Complex Data Stories Told Simply
The Challenge
City Energy Project is a joint initiative of the Institute for Market Transformation (IMF) and the Natural Resources Defense Council (NRDC). They partner with cities across the US to improve the energy efficiency of large buildings. With the heavy use of data analysis and the application of practical approaches, building owners, city officials and the public in each city had something to gain by collaborating. But each city is at a different place in their journey, with unique roadblocks impeding their progress. To navigate their individual paths, each needed to leverage data to convince their audiences to take the next steps.
By definition, building energy data is complex – and not something the audiences would understand in its original form. How can each city accomplish their communication goals with data-driven complex messages?

The Solution
All the cities had goals of improving the efficiency of the buildings for cost savings for building owners and tenants but each city also had needs specific to their project. We worked to understood their local “personality” and specific branding requirements. By leveraging the best practices of data-driven storytelling and data visualization, we were able to provide guidance on copy, develop content elements, streamline story flow and deliver communication structures in both print and digital formats for each city’s needs:
- Denver wanted to kick-off their project and encourage building owners to participate in the benchmarking process. By connecting that first step to the longer-term potential outcome of a thriving economy, an infographic poster illuminated the straightforward process and the commitment required.
- Des Moines was early in their project and needed to educate their residents in order to facilitate more buy-in to the concept. An infographic and flyer conveyed the goals and potential benefits to the local job market, economy and water supply.
- Salt Lake City was appealing to the local government officials to approve certain guidelines to support the initiative and needed to educate both the policymakers and their constituents. Clarifying the connection of the energy efficiency work with the goal of improving air quality to reduce the negative impact on children and adults with asthma was key. An infographic was built with targeted benefits defined and calls-to-action that delineated next steps in order to meet their communication needs.
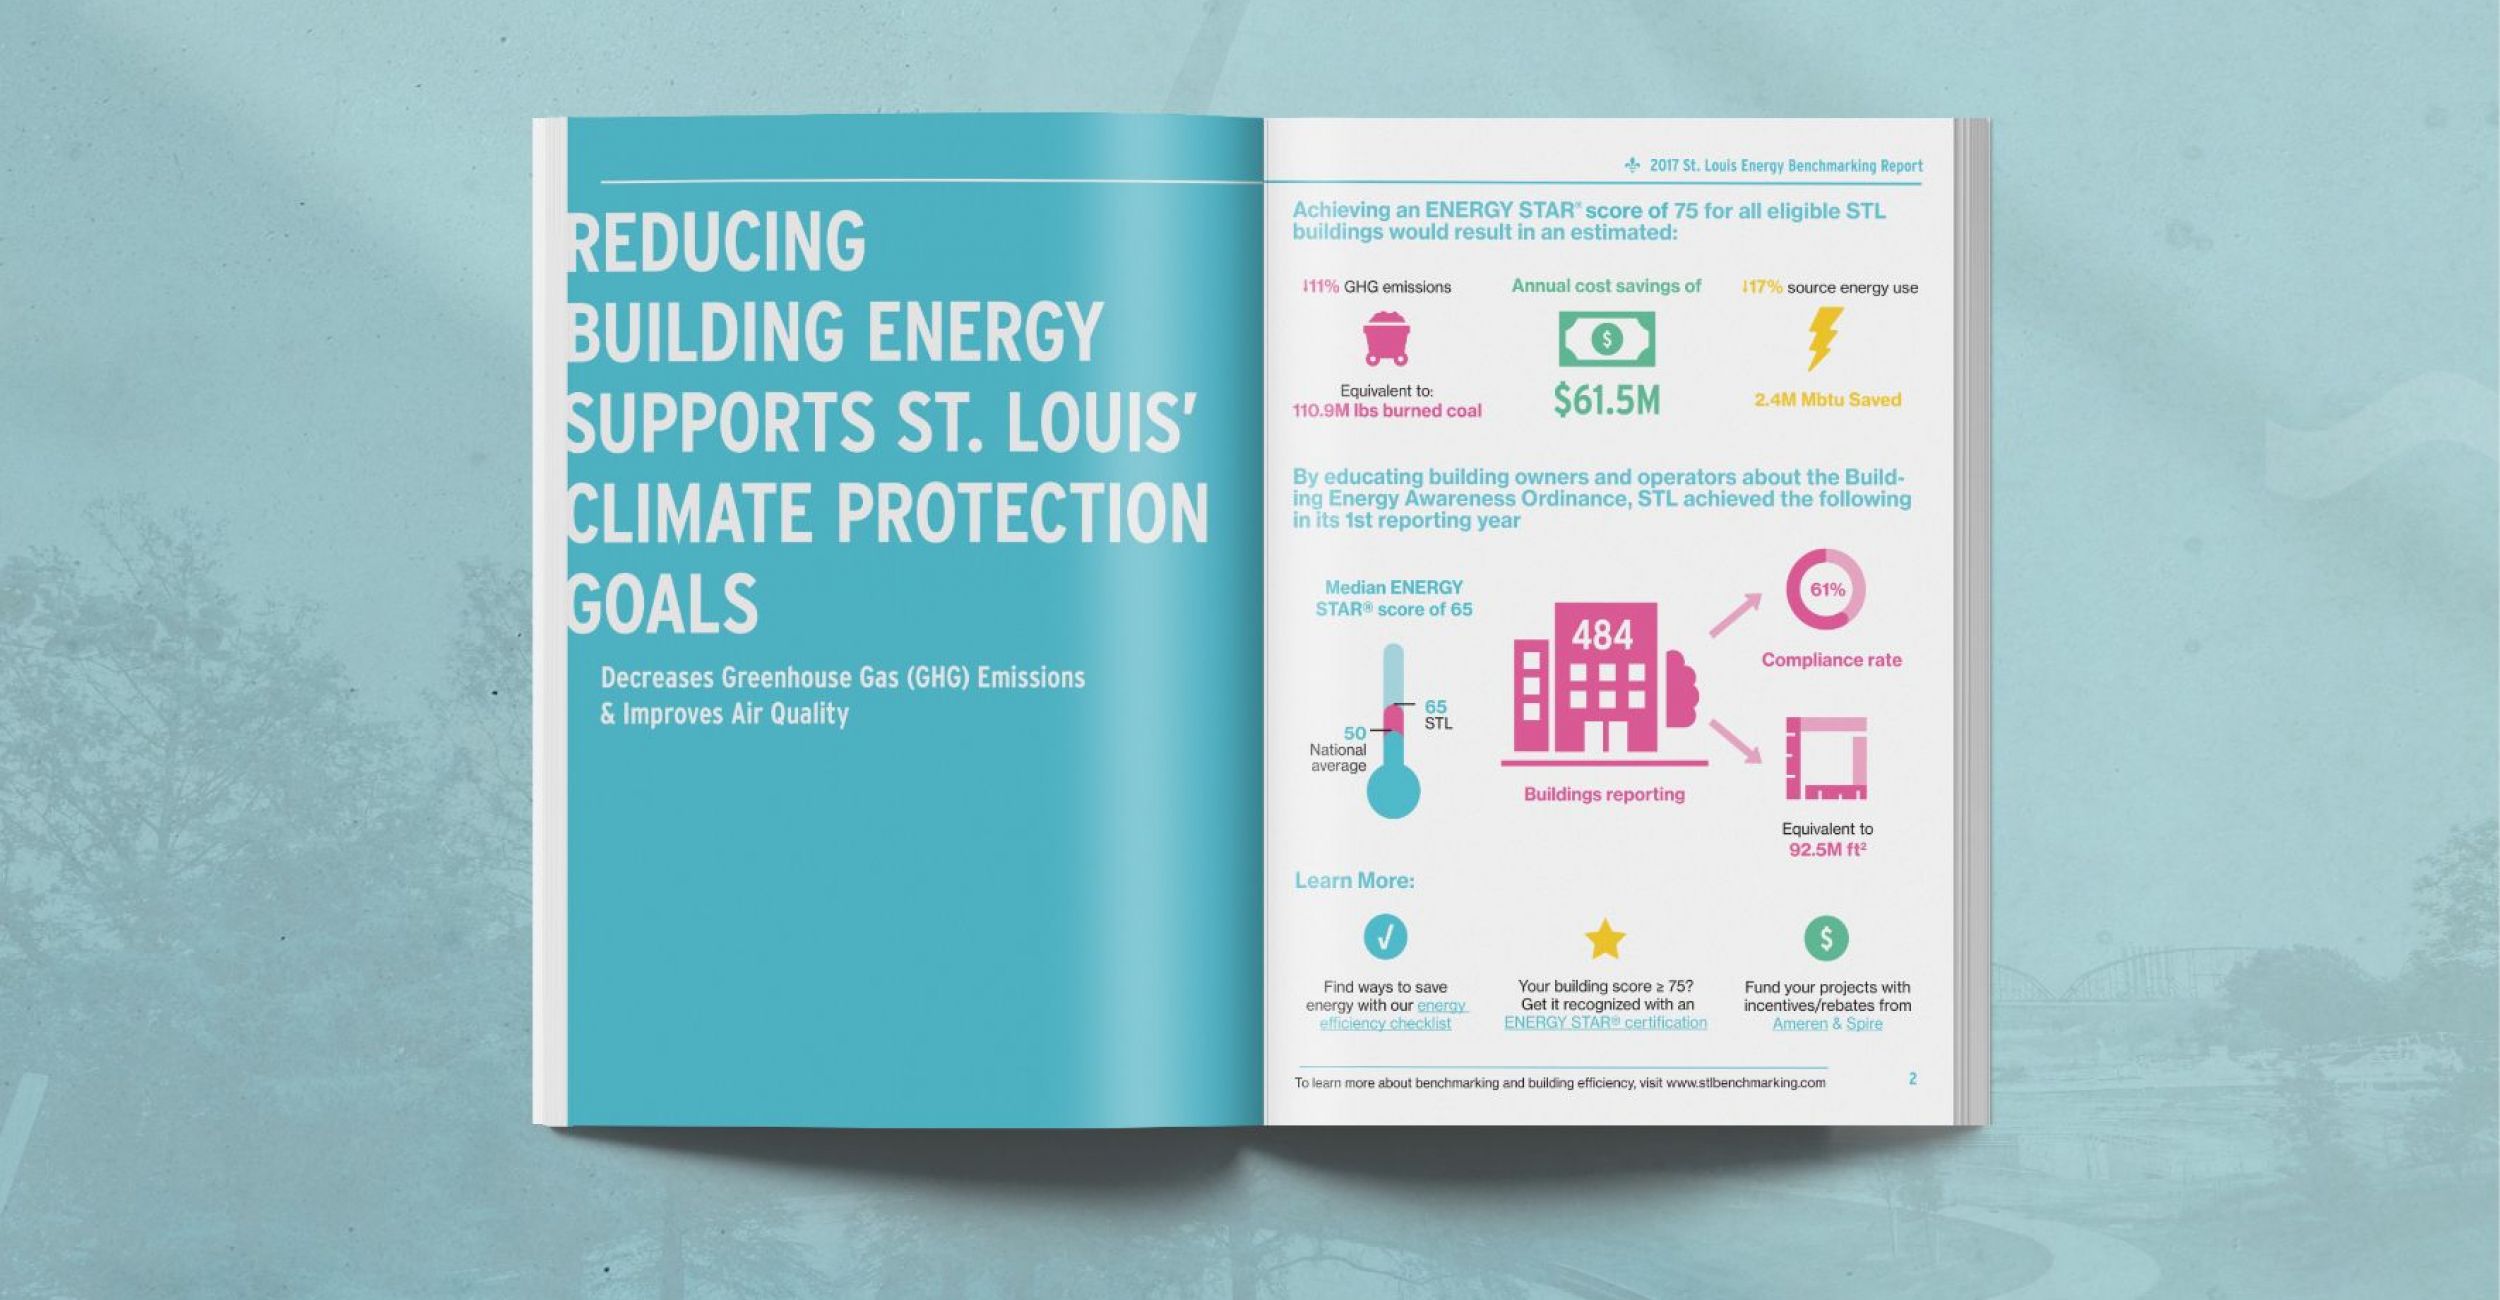
- St. Louis had collected the first year’s worth of data and was required to submit a full report. Water consumption was an important measure for this region. We crafted an integrated approach for both the storyline and data visualization structures to simplify and clearly convey the interim results in a multi-page report that both reported on benchmarking while educating the public on the overall process and goals.
- Chicago was one of the earliest adopters of the City Energy Project. With a city full of some of the tallest high rises in the country and wide ranging seasons requiring both heating and cooling, large building energy efficiency could provide many benefits to the residents and visitors. Our engagement began as they wrapped up their first year of data collection. For that initial year, they needed both a full report documenting the progress made to-date, plus also a clear “at-a-glance” one-page marketing piece. We renewed our collaboration over the remaining two mandated reporting years, each year with a unique multi-page report that expressed the progress and achievements in easy-to-consume, yet in-depth copy and graphics.
Related Work

Content as a Beacon for Boston Property

Empowering a PQC’s Efforts
